Appendices
Appendix 1. GRI Content Index
 *
*
|
GRI standard |
Indicator number |
Link |
Excluded information/comments |
UN sustainable development goal |
|---|---|---|---|---|
| GRI 101: Foundation (2016)72 | ||||
|
GRI 102: General Disclosures (2016) |
Organisational profile |
|||
|
102-1 |
– |
– |
||
|
102-2 |
– |
– |
||
|
102-3 |
– |
– |
||
|
102-4 |
– |
– |
||
|
102-5 |
– |
– |
||
|
102-6 |
– |
– |
||
|
102-7 |
– |
|||
|
102-8 |
– |
8 |
||
|
102-9 |
– |
– |
||
|
102-10 |
– |
|||
|
102-11 |
– |
– |
||
|
102-12 |
– |
– |
||
|
102-13 |
– |
– |
||
|
Strategy |
||||
|
102-14 |
– |
– |
||
|
102-15 |
– |
– |
||
|
Ethics and integrity |
||||
|
102-16 |
– |
16 |
||
|
102-17 |
– |
– |
||
|
Corporate governance |
||||
|
102-18 |
– |
– |
||
|
102-19 |
– |
– |
||
|
102-20 |
– |
– |
||
|
102-21 |
16 |
|||
|
102-22 |
– |
5, 16 |
||
|
102-23 |
– |
16 |
||
|
102-24 |
– |
5, 16 |
||
|
102-25 |
16 |
|||
|
102-26 |
– |
– |
||
|
102-27 |
– |
4 |
||
|
102-28 |
– |
|||
|
102-29 |
– |
16 |
||
|
102-30 |
– |
– |
||
|
102-31 |
– |
– |
||
|
102-32 |
– |
– |
||
|
102-33 |
– |
– |
||
|
102-34 |
– |
– |
||
|
102-35 |
– |
– |
||
|
102-36 |
– |
– |
||
|
102-37 |
– |
16 |
||
|
102-38 |
– |
Not disclosed for personal data protection reasons |
– |
|
|
102-39 |
– |
– |
||
|
Stakeholder engagement |
||||
|
102-40 |
– |
– |
||
|
102-41 |
– |
8 |
||
|
102-42 |
– |
– |
||
|
102-43 |
– |
– |
||
|
102-44 |
– |
– |
||
|
Reporting practice |
||||
|
102-45 |
– |
– |
||
|
102-46 |
– |
|||
|
102-47 |
– |
– |
||
|
102-48 |
– |
– |
||
|
102-49 |
– |
There are no changes in the reporting |
– |
|
|
102-50 |
– |
– |
||
|
102-51 |
– |
June 2018 |
– |
|
|
102-52 |
– |
Annual |
– |
|
|
102-53 |
– |
– |
||
|
102-54 |
– |
– |
||
|
102-55 |
– |
– |
||
|
102-56 |
– |
– |
||
|
Economic performance |
||||
|
GRI 103: Management Approach (2016) |
103-1 |
See also the Scope of Data Collection appendix in the interactive version of the Report |
– |
|
|
103-2 |
– |
1, 5, 8, 16 |
||
|
103-3 |
– |
– |
||
|
GRI 201: |
201-1 |
– |
2, 5, 7, 8, 9 |
|
|
201-2 |
Risks posed by climate change are not measured financially |
13 |
||
|
201-3 |
– |
– |
||
|
201-4 |
– |
The Group did not receive significant government grants for the 12 months ended 31 December 2018 |
– |
|
|
Market presence |
||||
|
GRI 103: Management Approach (2016) |
103-1 |
See also the Scope of Data Collection appendix in the interactive version of the Report |
– |
|
|
103-2 |
– |
1, 5, 8, 16 |
||
|
103-3 |
– |
– |
||
|
GRI 202: |
202-1 |
– |
1, 5, 8 |
|
|
202-2 |
– |
8 |
||
|
Indirect economic impacts |
||||
|
GRI 103: Management Approach (2016) |
103-1 |
See also the Scope of Data Collection appendix in the interactive version of the Report |
– |
|
|
103-2 |
– |
1, 5, 8, 16 |
||
|
103-3 |
– |
– |
||
|
GRI 203: Indirect Economic Impacts (2016) |
203-1 |
– |
2, 5, 7, 9, 11 |
|
|
203-2 |
– |
1, 2, 3, 8, 10, 17 |
||
|
Anti-corruption practices |
||||
|
GRI 103: Management Approach (2016) |
103-1 |
See also the Scope of Data Collection appendix in the interactive version of the Report |
– |
|
|
103-2 |
– |
16 |
||
|
103-3 |
– |
– |
||
|
GRI 205: |
205-1 |
– |
16 |
|
|
205-2 |
– |
16 |
||
|
205-3 |
None |
16 |
||
|
Energy |
||||
|
GRI 103: Management Approach (2016) |
103-1 |
See also the Scope of Data Collection appendix in the interactive version of the Report |
– |
|
|
103-2 |
– |
16 |
||
|
103-3 |
– |
– |
||
|
GRI 302: |
302-1 |
– |
7, 8, 12, 13 |
|
|
302-2 |
– |
Reporting not required by law |
7, 8, 12, 13 |
|
|
302-3 |
– |
7, 8, 12, 13 |
||
|
302-4 |
2018 Annual Report (page 133): |
7, 8, 12, 13 |
||
|
302-5 |
– |
Not applicable to the Company’s products |
7, 8, 12, 13 |
|
|
Water |
||||
|
GRI 103: Management Approach (2016) |
103-1 |
See also the Scope of Data Collection appendix in the interactive version of the Report |
– |
|
|
103-2 |
– |
16 |
||
|
103-3 |
– |
– |
||
|
GRI 303: |
303-1 |
– |
6 |
|
|
303-2 |
– |
6 |
||
|
303-3 |
– |
6, 8, 12 |
||
|
Biodiversity |
||||
|
GRI 103: Management Approach (2016) |
103-1 |
See also the Scope of Data Collection appendix in the interactive version of the Report |
– |
|
|
103-2 |
– |
16 |
||
|
103-3 |
– |
– |
||
|
GRI 304: Biodiversity (2016) |
304-1 |
– |
6, 14, 15 |
|
|
304-2 |
– |
6, 14, 15 |
||
|
304-3 |
– |
6, 14, 15 |
||
|
304-4 |
– |
6, 14, 15 |
||
|
– |
MM1 |
– |
3, 12, 14, 15 |
|
|
– |
MM2 |
– |
There are no such sites |
6, 14, 15 |
|
Emissions |
||||
|
GRI 103: Management Approach (2016) |
103-1 |
See also the Scope of Data Collection appendix in the interactive version of the Report |
– |
|
|
103-2 |
– |
16 |
||
|
103-3 |
– |
– |
||
|
GRI 305: Emissions (2016) |
305-1 |
– |
3, 12, 13, 14, 15 |
|
|
305-2 |
– |
The Company did not assess indirect energy-related GHG emissions. Regular GHG emission reporting to authorities is not required by law |
3, 12, 13, 14, 15 |
|
|
305-3 |
– |
3, 12, 13, 14, 15 |
||
|
305-4 |
– |
13, 14, 15 |
||
|
305-5 |
– |
The Company did not assess indirect energy-related GHG emissions. Regular GHG emission reporting to authorities is not required by law |
13, 14, 15 |
|
|
305-6 |
Emissions negligible |
3, 12, 13 |
||
|
305-7 |
– |
3, 12, 13, 14, 15 |
||
|
Effluents and waste |
||||
|
GRI 103: Management Approach (2016) |
103-1 |
See also the Scope of Data Collection appendix in the interactive version of the Report |
– |
|
|
103-2 |
– |
16 |
||
|
103-3 |
– |
– |
||
|
GRI 306: |
306-1 |
– |
3, 6, 12, 14 |
|
|
306-2 |
– |
3, 6, 12 |
||
|
306-3 |
– |
There are no significant spills |
3, 6, 12, 14, 15 |
|
|
306-4 |
– |
There are no such waste or waste transportation |
3, 12 |
|
|
306-5 |
– |
6, 15 |
||
|
Environmental compliance |
||||
|
GRI 103: Management Approach (2016) |
103-1 |
See also the Scope of Data Collection appendix in the interactive version of the Report |
– |
|
|
103-2 |
– |
16 |
||
|
103-3 |
– |
– |
||
|
GRI 307: Environmental Compliance (2016) |
307-1 |
– |
16 |
|
|
Environmental сompliance |
||||
|
GRI 103: Management Approach (2016) |
103-1 |
See also the Scope of Data Collection appendix in the interactive version of the Report |
– |
|
|
103-2 |
– |
16 |
||
|
103-3 |
– |
– |
||
|
Employment |
||||
|
GRI 103: Management Approach (2016) |
103-1 |
See also the Scope of Data Collection appendix in the interactive version of the Report |
– |
|
|
103-2 |
– |
5, 8, 16 |
||
|
103-3 |
– |
– |
||
|
GRI 401: Employment (2016) |
401-1 |
– |
5, 8 |
|
|
401-2 |
– |
8 |
||
|
401-3 |
Information is provided about employees on maternity leave and/or child care leave |
5, 8 |
||
|
Occupational health and safety |
||||
|
GRI 103: Management Approach (2016) |
103-1 |
See also the Scope of Data Collection appendix in the interactive version of the Report |
– |
|
|
103-2 |
– |
16 |
||
|
103-3 |
– |
– |
||
|
GRI 403: Occupational Health and Safety (2016) |
403-1 |
– |
8 |
|
|
403-2 |
No breakdown of injury rates by gender due to the lack of centralised records |
3, 8 |
||
|
403-3 |
– |
3, 8 |
||
|
403-4 |
– |
8 |
||
|
Training and education |
||||
|
GRI 103: Management Approach (2016) |
103-1 |
See also the Scope of Data Collection appendix in the interactive version of the Report |
– |
|
|
103-2 |
– |
16 |
||
|
103-3 |
– |
– |
||
|
GRI 404: |
404-1 |
No breakdown by gender due to the lack of centralised records |
4, 5, 8 |
|
|
404-2 |
– |
8 |
||
|
404-3 |
– |
5, 8 |
||
|
Freedom of association and collective bargaining |
||||
|
GRI 103: Management Approach (2016) |
103-1 |
See also the Scope of Data Collection appendix in the interactive version of the Report |
– |
|
|
103-2 |
– |
5, 8, 16 |
||
|
103-3 |
– |
– |
||
|
GRI 407: Freedom of Association and Collective Bargaining (2016) |
407-1 |
– |
There are no violations |
8 |
|
Rights of indigenous peoples |
||||
|
GRI 103: Management Approach (2016) |
103-1 |
See also the Scope of Data Collection appendix in the interactive version of the Report |
- |
|
|
103-2 |
– |
1, 5, 8, 16 |
||
|
103-3 |
– |
– |
||
|
GRI 411: Rights of Indigenous Peoples (2016) |
411-1 |
There are no violations |
2 |
|
|
– |
MM5 |
– |
The Group does not have any formal arrangements with indigenous northern minorities |
1, 2 |
|
Local communities |
||||
|
GRI 103: Management Approach (2016) |
103-1 |
See also the Scope of Data Collection appendix in the interactive version of the Report |
– |
|
|
103-2 |
– |
1, 5, 8, 16 |
||
|
103-3 |
– |
– |
||
|
GRI 413: |
413-1 |
– |
Such programmes are implemented in 4 out of 74 (5.4%) Group entities operating in Russia (the Company's Head Office, Kola MMC, Polar Division, and Nornickel — Shared Services Centre) within the reporting perimeter |
– |
|
413-2 |
– |
1, 2 |
||
|
– |
MM6 |
None |
1, 2 |
|
|
– |
MM7 |
– |
No disputes |
1, 2 |
|
Supplier social assessment |
||||
|
GRI 103: Management Approach (2016) |
103-1 |
See also the Scope of Data Collection appendix in the interactive version of the Report |
– |
|
|
103-2 |
– |
5, 8, 16 |
||
|
103-3 |
– |
– |
||
|
Public policy |
||||
|
GRI 103: Management Approach (2016) |
103-1 |
See also the Scope of Data Collection appendix in the interactive version of the Report |
– |
|
|
103-2 |
– |
5, 8, 16 |
||
|
103-3 |
– |
– |
||
|
GRI 415: |
415-1 |
– |
No contributions were maid to political goals |
16 |
|
Socioeconomic compliance |
||||
|
GRI 103: Management Approach (2016) |
103-1 |
See also the Scope of Data Collection appendix in the interactive version of the Report |
– |
|
|
103-2 |
– |
5, 8, 16 |
||
|
103-3 |
– |
– |
||
|
GRI 419: Socioeconomic Compliance (2016) |
419-1 |
– |
16 |
|
|
Emergency preparedness |
||||
|
GRI 103: Management Approach (2016) |
103-1 |
See also the Scope of Data Collection appendix in the interactive version of the Report |
– |
|
|
103-2 |
– |
16 |
||
|
103-3 |
– |
– |
||
|
– |
MM3 |
– |
3, 6, 12 |
|
|
Closure planning |
||||
|
GRI 103: Management Approach (2016) |
103-1 |
See also the Scope of Data Collection appendix in the interactive version of the Report |
– |
|
|
103-2 |
– |
1, 5, 8, 16 |
||
|
103-3 |
– |
– |
||
|
– |
MM10 |
– |
The IFRS financial statements reflect a decommissioning provision for 9% of the operations within the reporting perimeter. As at 31 December 2018, this provision stood at RUB 23,415 mln |
– |
Appendix 3. Map of material GRI topics (aspects)80
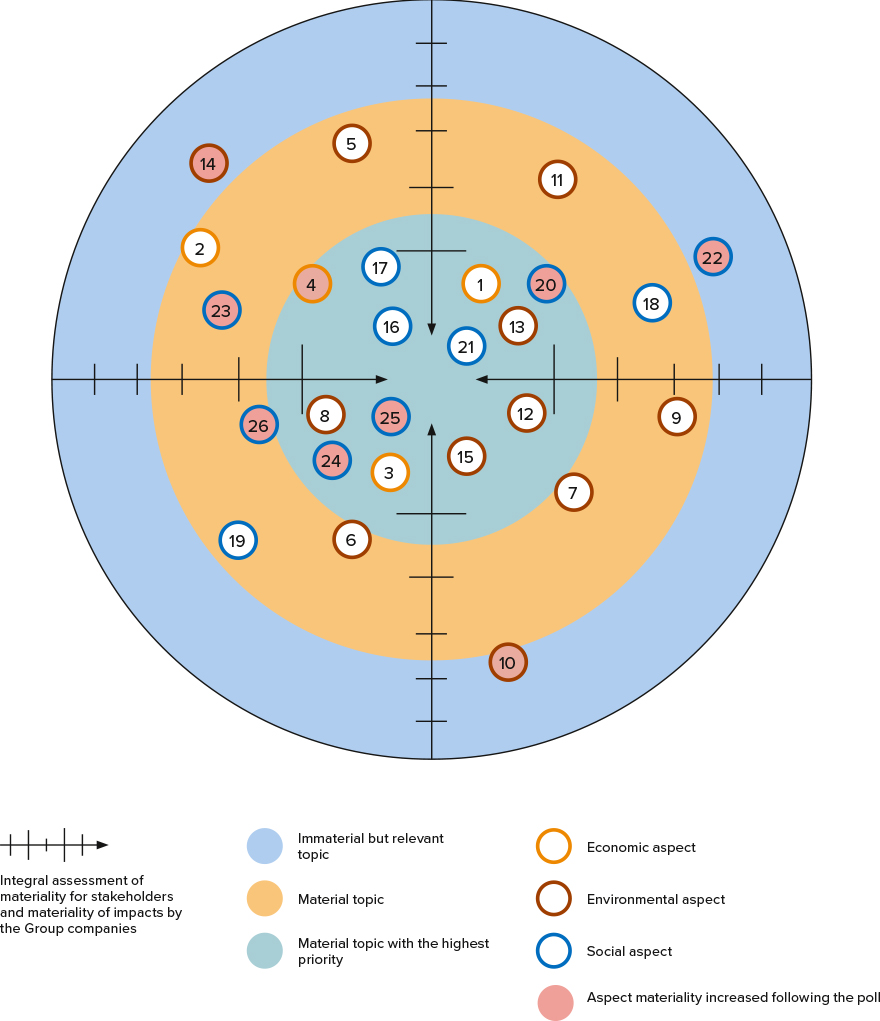
- Economic performance
- Market presence
- Indirect economic impacts
- Anti-corruption practices
- Energy
- Water
- Biodiversity
- Sulphur dioxide and solid emissions81
- Greenhouse gas (GHG) emissions
- Emissions of ozone-depleting substances (ODS)
- Emissions of other substances
- Effluents82
- Waste
- Supplier environmental assessment
- Environmental compliance
- Employment
- Occupational health and safety
- Training and education
- Freedom of association and collective bargaining
- Human rights: Rights of indigenous peoples83
- Local communities
- Supplier social assessment
- Public policy
- Socioeconomic compliance
- Emergency preparedness
- Closure planning
Appendix 10. Opinion of RSPP Council on Non-Financial Reporting
Opinion of the RSPP Council on Non-Financial Reporting on Norilsk Nickel Group’s 2018 Sustainability Report for the purposes of public verification
The Council on Non-Financial Reporting of the Russian Union of Industrialists and Entrepreneurs (the “Council”) established as per the Management Bureau’s Resolution dated 28 June 2007, reviewed, at the request of MMC Norilsk Nickel (the “Company”, the “Group”, “Norilsk Nickel”) Norilsk Nickel Group’s 2018 Sustainability Report (the “Report”).
The Company requested the RSPP to arrange for the public verification of the Report, with the Council on Non-Financial Reporting providing an opinion on the materiality and completeness of the Report’s information about the Company’s operations from the perspective of the Social Charter of the Russian Business. The Charter sets out key principles of responsible business conduct aligned with those of the UN Global Compact, as well as domestic and international CSR standards.
From 29 April to 20 May 2019, the Council members reviewed the content of the Company’s Report and issued this Opinion in accordance with the Council's Procedure for Public Verification of Corporate Non-Financial Reports.
The Council members possess all the required competencies in corporate responsibility, sustainable development and non-financial reporting, comply with the ethical requirements for independence and impartiality, and provide their personal expert opinion rather than the opinion of organisations they represent.
The Report was assessed based on the below-listed criteria of information completeness and materiality.
Information is considered to be material if it reflects the company's efforts to implement the principles of responsible business conduct set out in the Social Charter of the Russian Business (see www.rspp.ru).
Completeness implies that the company provides a comprehensive overview of its operations, including the underlying values and strategic benchmarks, governance systems and structures, accomplishments and key results, and the stakeholder relationship framework.
The procedure for the public verification of the Report factors in the Company’s application of international reporting frameworks; this Opinion does not, however, purport to assess the Report’s compliance with such international frameworks.
The Company is responsible for the information and statements provided in the Report. The accuracy of the Report’s information is beyond the scope of the public verification procedure.
This opinion has been prepared for MMC Norilsk Nickel. The Company may use it for both corporate and stakeholder communication purposes by publishing the original version without any changes.
CONCLUSIONS
Based on the review of the Report and the information publicly available on the Company’s official website, and following a collective discussion of the results of the Report’s independent assessment undertaken by the members of the Council on Non-Financial Reporting, the Council confirms as follows.
Norilsk Nickel Group’s 2018 Sustainability Report covers the key areas of responsible business conduct in accordance with the principles set out in the Social Charter of the Russian Business, and provides sufficient information about the Company’s operations in relation thereto.
The recommendations made by the Council following the public verification of Norilsk Nickel Group’s 2017 Report were largely implemented in the 2018 Report. In particular, the report offers more detailed comments on changes in indicators and provides additional references to information sources, including the annual report. The report also addresses the performance of the Norilsk Development Agency, covers the sustainability efforts of the Board of Directors' dedicated committee, and provides more information on the alignment of the Company's activities with the UN 2030 Agenda for Sustainable Development.
The Company’s 2018 Report contains relevant information relating to the below-listed aspects of responsible business conduct.
Economic freedom and responsibility. The Report presents the Company’s operational and financial results, highlighting its contribution to Russia’s economy and its engagement in the Arctic. It notes the rise in the output of key metals and revenue driven by greater production efficiency across the board. Information is provided on the commissioning of advanced Bystrinsky GOK and the launch of the Sulphur Project at Polar Division's Copper Plant. Other highlights include a significant improvement in health and safety performance. The Report outlines the Company's strategic priorities. It states that Nornickel embarked on the second stage of its environmental programme, launching initiatives to upgrade infrastructure, accelerate digitalisation, and other projects. The Report discloses the Company’s corporate governance structure and approaches to sustainable development management. It highlights Nornickel’s contribution to achieving the UN Sustainable Development Goals. Information is presented on recertification audits for compliance with international standards of the quality and environmental management system. Also included is information on the employee performance management and competence assessment systems, and the risk management system. The Report informs that the Company has adopted a number of regulations on the information security of Nornickel's assets and operations. It also identifies focus areas and outlines the Company’s efforts in preventing and combating corruption, including the corruption risk assessment performed across the Group’s business units.
Business partnerships. The Report presents a stakeholder map together with the description of key stakeholder engagement mechanisms and initiatives. It specifies the details of meetings with institutional and target investors focused on responsible investment, and the launch of a dedicated section of the corporate website with a view to improving investor relations and those with ESG assessment agencies. The Report prioritises personnel development and describes respective management approaches and programmes implemented in employees’ interests, as well as health and safety strategy and performance. It also covers social partnership framework across the Group and discloses information on feedback channels for employees. The Report provides information on supplier relations with a focus on equal competition, corruption control, and feedback channels. It states that ESG requirements are incorporated into standard master agreements with suppliers and contractors, and presents information on the monitoring of contractors’ compliance with health and safety requirements when carrying out the work, as well as on incorporating a binding anti-corruption clause into supplier agreements. It also provides information on quality assurance measures, customer satisfaction monitoring, new formats of interaction with regional authorities, continuous engagement in expert and consulting working groups established by government authorities to implement socially important projects, as well as on close interaction with business associations and NPOs. It describes strategic partnerships with Russian and foreign organisations set up with a view to achieving sustainable development goals and promoting green economy, and covers cooperation in creating a global mechanism to ensure reliability of precious metals supplies and addressing the global information security agenda.
Human rights. The Report covers regulatory and managerial aspects of the Company’s respect of human rights, noting that Nornickel has a Human Rights Policy in place and that the principle of respecting human rights is set out in the Company's by-laws governing the HR, environmental, social and other matters. The Report also focuses on the respect of employees’ social and labour rights, offering them a competitive salary, social benefits, decent working conditions, professional development, and career growth. It describes the procedures in place for identifying human rights violations, stating that no such violations were recorded in the reporting period. It covers key areas of Nornickel's interaction with indigenous northern minorities and the Company's relevant commitments set forth in its Indigenous Rights Policy. In 2018, Nornickel and the Federal Agency for Ethnic Affairs (FAEA) signed a cooperation agreement to provide support to indigenous northern minorities who reside in the areas where the Company operates.
Environmental protection. The Report includes information on starting the second stage of the Company’s environmental programme, approving the Integrated Action Plan to Reduce Air Pollutant Emissions at Polar Division in 2019–2024, and launching a concentrator upgrade project at Kola MMC. It presents details on the environmental management system and efforts to manage the climate impact, reduce greenhouse emissions, save energy, improve energy efficiency and develop the Company’s energy infrastructure. It traces changes in quantitative indicators associated with the Company's environmental impact, broken down by key facilities, including its foreign asset Norilsk Nickel Harjavalta, as well as environmental expenditures and costs. The Report evaluates the impact of the Company's vehicle fleet as insignificant and describes Nornickel's approaches to biodiversity conservation, land rehabilitation and other environmental protection initiatives associated with field development, construction and other operations. It offers insights into cooperation with nature reserves, employee involvement in environmental initiatives, and environment-related interaction between the Company and broader community.
Contribution to the development of local communities. The Report highlights the Company's contribution to the development of local communities as the largest taxpayer and employer and also as participant of important regional and federal programmes and major infrastructure projects. It specifies the key focus areas of implementing social and economic agreements with government authorities in five regions across the Group’s footprint (Krasnoyarsk Territory, Murmansk Region, Trans-Baikal Territory, Tver Region and Saratov Region). It presents information on key socially important economic and environmental projects implemented in these regions and covers the details of fostering cooperation with local businesses. The Report notes the Company’s career guidance focus seeking to facilitate the employment of population, including young people. It discloses the performance results of the Norilsk Development Agency and provides the list of key social infrastructure development projects of 2018. It details the results of the World of New Opportunities charitable programme across three focus areas — Partnership, Innovations, and Development, along with major projects implemented by the Company as the General Partner of the 29th International Winter Universiade 2019 in Krasnoyarsk. It also addresses the Plant of Goodness corporate volunteer programme, describes approaches to the assessment of social programmes and public-private partnerships, and discloses information on social spending.
Final provisions
Information in the Report generally reflects the Company’s consistent work towards the integration of corporate social responsibility and sustainable development principles into its business practices. The Report contains a significant amount of information about the Company’s impact on the society and environment, its strategy and policies in the key focus areas, and the effect of the related programmes. It covers the main focus areas and formats of stakeholder engagement, including those used as part of the reporting process.
The Report was prepared using internationally and domestically recognised reporting tools (e.g. the GRI Standards, Comprehensive option, GRI Sector Disclosures and the RSPP Reference Performance Indicators), which ensures comparability of the Group's information with that of other Russian and international companies. The Report is also in line with the UN Global Compact and the UN 2030 Agenda for Sustainable Development.
The 2018 Report is the Company’s fifteenth non-financial report, which demonstrates its determination to consistently develop reporting processes and enhance transparency. The Company uses various forms of independent assessment and confirmation of disclosed information (professional audit and public verification). This reflects the Company’s commitment to keeping stakeholders informed and maintaining the high quality of disclosures.
RECOMMENDATIONS
While acknowledging the Report’s strengths, the Council calls attention to some aspects of disclosures’ materiality and completeness, which should be addressed in the future reporting cycles.
The Report outlines Nornickel’s strategic priorities and we regard this data as material for the stakeholders. However, the Company’s strategy deserves a more detailed disclosure in the sustainability report, and it is therefore recommended to use more references to the sources where the relevant information is presented in more detail (e.g. the annual report). Cross-references in the Company's public reports ensure a more complete disclosure of material information without a significant increase in the size of reports, while also enabling comparability of information contained in different sources.
The Report reflects the results of the inventory of significant projects and programmes in line with the UN 2030 Agenda for Sustainable Development. Nornickel is advised to continue disclosing information on the progress towards the UN 2030 Agenda for Sustainable Development, using it among other criteria for assessing implementation of the goals and objectives of the Company's strategic priorities.
The Report states that the Company’s by-laws provide for the control over compliance with the anti-corruption clause in agreements with suppliers and contractors, as well as their implementation of the work safety recommendations. It is advised that future reports describe the Company's impact on their business ethics, and social and environmental responsibility practices in more detail. It would be useful to provide examples of how ESG aspects are monitored as part of assessing the reliability of business partners, and how the latter implement relevant policies and standards into their business practices. Taking into account the new practice of the Company's adherence to the codes of conduct devised by foreign manufacturers, it seems reasonable to describe the Company's experience in this area going forward.
The Report highlights the Company’s high degree of transparency and the use of various formats of stakeholder engagement. It would be appropriate to add a description of how feedback from stakeholders is used in management practices, namely in improving business processes and refining social programmes. In particular, this also applies to disclosing the results of the Company’s Social Portrait of a City Resident analytical survey in the Krasnoyarsk Territory and the Murmansk Region.
The Company's reports generally provide full information on energy consumption and environmental impact across all key divisions. To improve this area of disclosure, it is further advised to report on the relevant performance of support functions (transportation, gas production, electricity generation) and smaller units, such as Bystrinsky GOK.
The Report contains information on Nornickel’s efficiency improvement programme seeking, among other things, to introduce innovative management solutions. In future reporting cycles, it is advisable to give more detailed information on the achievements in this area, including the set of KPIs related to sustainable development.
Taking into account the Company's active role in implementing national priorities as stated in the Report, it would be useful to provide more details on its further participation in national projects, such as the Environment, the Digital Economy, and the Smart City initiatives, going forward. This would enable a more complete understanding of the Company's social and environmental impact as one of the major players in the Russian business market.
The RSPP Council on Non-Financial Reporting hereby takes a positive view of this Report, supports the Company’s commitment to responsible business practices, notes consistency in developing the reporting process, and confirms that Norilsk Nickel Group’s 2018 Sustainability Report has passed the public verification procedure.
RSPP Council on Non-Financial Reporting